When something goes wrong in PostgreSQL, most people first look at logs, queries, or monitoring dashboards. But there’s another very powerful tool built right into the PostgreSQL system catalogs.
These are special tables that PostgreSQL maintains internally. They keep track of everything inside the database, like tables, columns, indexes, roles, and functions. By querying these catalogs, you can find important details that help fix problems, check configurations, and understand what’s happening in your database.
In a recent escalation from the client environment we observed that the system was experiencing very high CPU usage, with significant memory consumption and processing delays. One particular query was running for more than 13 hours, as identified using pg_stat_activity. We analyzed and terminated the long-running query.
After terminating the query, we monitored the number of concurrent connections during peak hours. This helped us identify and address the source of the load, ensuring that we could reduce system pressure without causing locks or blocking other transactions on the same table.
In this post, let’s look at what system catalogs are, why they matter, and how we can use them to troubleshoot issues.
What are PostgreSQL system catalogs?
Think of system catalogs as PostgreSQL’s internal directory. Every time we create a table, index, or role, PostgreSQL saves information about it here. Even PostgreSQL itself uses these catalogs to know what exists in the database.
Some common catalogs are:
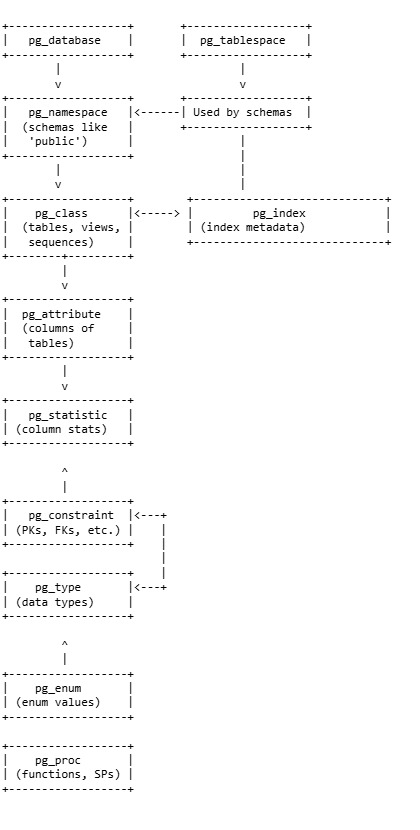
- pg_class – information about one row for each table, index, sequence, view, etc.
- pg_attribute – details about columns
- pg_roles – list of users and roles
- pg_indexes – details about indexes
These are not created by users, but automatically by PostgreSQL. The good part is: we can query them using normal SQL.
This will help you understand the internal structure and flow of metadata in PostgreSQL.
PostgreSQL System Catalogs: Metadata Diagram
Why are catalogs useful in troubleshooting?
Catalogs are super helpful when we need to:
- Check if an index exists or is being used
- Find bloated tables and dead rows
- Debug permission errors by checking user roles
- Diagnose slow queries by looking at statistics
- See dependencies before dropping or changing objects
In short, they give you visibility into the internals of PostgreSQL.
Common catalogs for troubleshooting
Here are some useful ones you’ll often query:
1. pg_stat_activity
Shows all current queries and connections.
postgres=# SELECT pid, usename, state, query
FROM pg_stat_activity;
pid | usename | state | query
------+----------+--------+-----------------------------------
1393 | | |
1395 | postgres | active |COPY shc.sml_prod_smaples (id, create_date, request_message, response_message, raw_response, group_id, customer_id, error_msg, req_id, job_name, class_name, start_date, end_date, job_status, message, si_type, source, trigger_host, ref_id, type, ref_no) TO stdout;
1432 | postgres | active | SELECT pid, usename, state, query+
| | | FROM pg_stat_activity;
1390 | | |
1394 | | |
1389 | | |
1392 | | |
(7 rows)
– Use this to find slow or blocked queries.
2. pg_class + pg_attribute
Gives table and column details.
SELECT relname, reltuples, relpages
FROM pg_class
WHERE relkind = 'r'; -- 'r' = ordinary table
      relname           | reltuples | relpages
--------------------------+-----------+----------
users | 1e+06 | 9346
orders | 1e+06 | 9346
test | 100000 | 443
pg_statistic | 409 | 19
pg_type | 613 | 15
test2 | 100000 | 443
pg_foreign_table | 0 | 0
pg_authid | 15 | 1
pg_statistic_ext_data | 0 | 0
pg_user_mapping | 0 | 0
pg_subscription | 0 | 0
pg_attribute | 3108 | 57
pg_proc | 3297 | 98
pg_class | 413 | 14
pg_attrdef | 0 | 0
pg_constraint | 112 | 3
pg_inherits | 0 | 0
pg_index | 164 | 4
pg_operator | 799 | 14
pg_opfamily | 146 | 2
pg_opclass | 177 | 3
pg_am | 7 | 1
pg_amop | 945 | 7
pg_amproc | 696 | 5
pg_language | 4 | 1
pg_largeobject_metadata | 0 | 0
pg_aggregate | 157 | 2
pg_statistic_ext | 0 | 0
pg_rewrite | 143 | 13
pg_trigger | 0 | 0
pg_event_trigger | 0 | 0
pg_description | 5233 | 45
pg_cast | 229 | 2
pg_enum | 0 | 0
pg_namespace | 4 | 1
pg_conversion | 128 | 2
pg_depend | 1704 | 13
pg_database | 2 | 1
pg_db_role_setting | 0 | 0
pg_tablespace | 2 | 1
pg_auth_members | 3 | 1
– Good for checking table size and row estimates.
3. pg_indexes
Lists indexes on a table.
postgres=# SELECT indexname, indexdef
FROM pg_indexes
WHERE tablename = 'orders';
indexname | indexdef
-------------+-------------------------------------------------------------------
orders_pkey | CREATE UNIQUE INDEX orders_pkey ON public.orders USING btree (id)
(1 row)
– Helpful when you think an index is missing or not being used.
4. pg_locks
Shows lock information.
postgres=# SELECT pid, relation::regclass, mode, granted
FROM pg_locks
JOIN pg_class ON pg_class.oid = pg_locks.relation;
pid | relation | mode | granted
------+-----------------------------------+-----------------+---------
1432 | pg_class_tblspc_relfilenode_index | AccessShareLock | t
1432 | pg_class_relname_nsp_index | AccessShareLock | t
1432 | pg_class_oid_index | AccessShareLock | t
1432 | pg_class | AccessShareLock | t
1432 | pg_locks | AccessShareLock | t
(5 rows)
– Helps when queries are blocked or there are deadlocks.
5. pg_stat_all_tables
Provides table-level stats.
postgres=# SELECT relname, n_tup_ins, n_tup_upd, n_tup_del, n_dead_tup
FROM pg_stat_all_tables
WHERE schemaname = 'public';
relname | n_tup_ins | n_tup_upd | n_tup_del | n_dead_tup
-------------------------------+-----------+-----------+-----------+------------
last_stat_statements_srv1 | 377853 | 19764 | 377439 | 0
last_stat_database_srv1     | 475 | 0 | 475 | 35
sample_stat_tables             | 22854 | 0 | 22533 | 262
samples                                | 95 | 0 | 94 | 17
last_stat_indexes_srv1       | 705975 | 6840 | 705942 | 0
sample_stat_archiver         | 95 | 0 | 94 | 17
(4 rows)
– Great for spotting dead rows and deciding if you need VACUUM.
Practical troubleshooting scenarios
1. Bloated Tables
Check for dead rows that slow down queries:
postgres=# SELECT relname, n_dead_tup
FROM pg_stat_all_tables
ORDER BY n_dead_tup DESC
LIMIT 5;
relname | n_dead_tup
---------------------+------------
pg_shdepend | 2496
sample_stat_tables | 262
pg_statistic | 191
sample_statements | 112
sample_stat_indexes | 72
(5 rows)
High values = time for VACUUM or ANALYZE.
2. Blocking queries
Find queries blocking others:
When queries hang or transactions freeze, it’s often due to locks. PostgreSQL uses locks to protect data integrity, but sometimes one query holds a lock that another query needs, leading to blocking.The query below helps you see which queries are blocking others:
postgres=# SELECT blocked_locks.pid     AS blocked_pid,
       blocked_activity.query AS blocked_query,
       blocking_locks.pid    AS blocking_pid,
       blocking_activity.query AS blocking_query
FROM pg_locks blocked_locks
JOIN pg_stat_activity blocked_activity
  ON blocked_activity.pid = blocked_locks.pid
JOIN pg_locks blocking_locks
  ON blocking_locks.locktype = blocked_locks.locktype
  AND blocking_locks.database IS NOT DISTINCT FROM blocked_locks.database
  AND blocking_locks.relation IS NOT DISTINCT FROM blocked_locks.relation
  AND blocking_locks.page IS NOT DISTINCT FROM blocked_locks.page
  AND blocking_locks.tuple IS NOT DISTINCT FROM blocked_locks.tuple
  AND blocking_locks.pid != blocked_locks.pid
JOIN pg_stat_activity blocking_activity
  ON blocking_activity.pid = blocking_locks.pid
WHERE NOT blocked_locks.granted;
 blocked_pid | blocked_query | blocking_pid | blocking_query
------------------+-----------------------+--------------------+----------------
(0 rows)
Explanation Step by Step
pg_locks
Stores details about all locks currently held or requested.
A row exists for each process (pid) trying to acquire a lock.
blocked_locks vs blocking_locks
blocked_locks: queries waiting for a lock (not granted yet).
blocking_locks: queries already holding the lock.
pg_stat_activity joins
Joins help us pull the SQL text (query) for both blocked and blocking processes.
blocked_activity.query – The query that’s waiting.
blocking_activity.query – The query that’s holding the lock.
The conditions in the JOIN
Matching locktype, database, relation, page, tuple ensures we’re looking at the same lock resource.
blocking_locks.pid != blocked_locks.pid avoids self-matching.
WHERE NOT blocked_locks.granted
Filters results to only queries that are currently blocked, not those that already have the lock.
How It Helps
DBA can quickly identify lock contention.
Developers can see which part of their app causes blocking.
We can decide whether to kill the blocking query, optimize transaction design, or reduce lock contention by adding indexes.
3. Index troubleshooting
Check if indexes are really being used:
postgres=# SELECT relname, idx_scan, idx_tup_read, idx_tup_fetch
FROM pg_stat_all_indexes
WHERE schemaname = 'public'
ORDER BY idx_scan ASC;
relname | idx_scan | idx_tup_read | idx_tup_fetch
---------+----------+--------------+---------------
users | 0 | 0 | 0
orders | 0 | 0 | 0
(2 rows)
– If idx_scan is low, queries may not be using the index.
Tips for using system catalogs
- Prefer views like
pg_stat_activityinstead of raw tables — they are easier to read. - Remember: statistics (
pg_stat_*) are not always real-time; runANALYZEfor fresh values. - Combine catalog queries with monitoring tools like
pg_stat_statementsfor deeper insights.
Conclusion
System catalogs are like PostgreSQL’s X-ray machine. They reveal what’s happening inside the database: tables, locks, queries, and stats. Whether we are fixing blocking queries, checking index usage, or cleaning bloated tables, catalogs give us the inside view you need. The more comfortable we get with them, the faster we’ll troubleshoot and solve problems in PostgreSQL.