1.Storage engines / replication: Aiven for ClickHouse supports the full MergeTree family (e.g. MergeTree, SummingMergeTree, AggregatingMergeTree, etc.), and in replicated databases these are automatically remapped to their ReplicatedMergeTree counterparts to provide high availability and consistent data across nodes. ClickHouse’s Kafka engine enables real-time ingestion with exactly-once semantics. The pattern involves a Kafka table, a materialized view, and a destination table.
2.Columnar storage & compression: ClickHouse is a columnar database, storing values of each column together, which improves scan speed, compression, and aggregation performance for analytical workloads over billions of rows.
3.Indexing & partitioning model (high‑level): ClickHouse uses sparse primary indexes and sorts data by the primary key, which is crucial for limiting how much data must be scanned per query. This is well‑suited to analytical patterns (e.g., time‑based or dimension‑based access) but less suited to single‑row lookups.
Partitioning Models Optimized for Query PatternsTime-Based Partitioning
Partitioning enables efficient data pruning and lifecycle management. The key is matching partition granularity to your query patterns and retention policies.
(i)Common Patterns:
• Daily: PARTITION BY toYYYYMMDD(timestamp) – Default for most analytics
• Monthly: PARTITION BY toYYYYMM(timestamp) – Historical data, slower ingestion
• Hourly: PARTITION BY toYYYYMMDDhh(timestamp) – Real-time dashboards, high volume
• Multi-Dimensional: PARTITION BY (toYYYYMM(timestamp), region) – Geographic isolation
(II)Partition Size Guidelines:
Target:
| size | Usage |
| Medium | 100GB-1TB per partition for optimal merge performance |
| Too small | <10GB creates excessive merge overhead |
| Too Large | >2TB slows down mutations and TTL |
operations—–Table format
(III)TTL(Time-To-Live) and Data Lifecycle
TTL policies enable automatic data tiering and cleanup, critical for cost management at scale.
Example: Multi-Tier Strategy,This configuration keeps hot data on fast SSDs for 30 days, moves to cheaper storage for days 31-90, then deletes. Volume configuration requires storage policy setup.
4.Tiered storage for cost/performance: Aiven for ClickHouse offers tiered storage, combining SSD with object storage. You can define TTLs so that older data is moved automatically to cheaper object storage, trading some query latency on cold data for lower cost while keeping recent data on SSD for sub‑second analytics.
5.Materialized views for query performance: Materialized views precompute aggregations and other heavy transformations at ingest/merge time, so queries over large datasets can run much faster and more cheaply. This is particularly effective in ClickHouse because of its columnar storage and MergeTree engines.
6.Managed operational layer (replicas, backups, upgrades):
- Aiven runs ClickHouse as a multi‑master cluster with full schema and data replication within a shard, using ZooKeeper for coordination and Astacus for backups and restore.
- Backups are automatic (every 24 hours) with retention depending on plan, and maintenance/upgrade operations are handled by Aiven with 99.99% SLA and configurable maintenance windows.
Aiven for ClickHouse supports a Kafka table engine via integration, and the product has built‑in data integrations with Aiven for Kafka and PostgreSQL, enabling multi‑format ingestion pipelines into ClickHouse.
Price/performance & benchmarking guidance (Aiven side): Aiven has benchmarked hyperscaler instances using ClickBench and moved to newer instance families (e.g., AWS m8g with EBS, GCP C4/C4a with Hyperdisk) to improve price/performance. This underpins new ClickHouse plans where you can often double compute for the same price or cut cost up to ~30% for the same compute, and use Dynamic Disk Sizing to scale storage independently.
7.Benchmarking:
ClickBench to benchmark because it is a robust standard specifically designed for an analytical DBMS like ClickHouse.
The Dataset: A 100-million-row “hits” dataset, reflecting common ClickHouse practices.
The Queries: 43 ClickBench queries to test various analytical workloads.
Hot vs. Cold Runs: Each query was run multiple times, simulating both initial (cold) and subsequent (hot) data access scenarios.
8.Performance Score: calculated a geometric mean of normalized scores, providing a single, balanced performance score for each VM, where a lower score indicates better performance.
Pricing: compared instances in AWS us-west-2 and GCP us-central-1, including at least 1TB of storage for a fair baseline. For VMs with attached SSDs, we used that storage for benchmarks; for others, we used EBS gp3 on AWS or Hyperdisk on GCP.
9.What Engineers Own
Even with managed infrastructure, application teams retain critical responsibilities:
• Schema Design: Table engines, primary keys, partitioning strategies
• Query Optimization: Analyzing execution plans and refactoring slow queries
• Data Modeling: Materialized views, aggregation strategies, denormalization
• Ingestion Pipelines: Kafka consumers, batch imports, transformation logic
• Capacity Planning: Forecasting storage and compute needs
Integration Patterns
Aiven provides pre-configured integrations that simplify common architectures:
• Kafka Connect: Direct topic-to-table ingestion with schema registry
• PostgreSQL CDC: Real-time replication from transactional databases
• S3 Export: Scheduled exports for data lake integration
• Grafana: Native ClickHouse data source for real-time dashboards
10.Modeling for High-Cardinality Attributes
The Cardinality Challenge:
High-cardinality dimensions (user IDs, session IDs, request IDs) can destroy query performance if not handled properly. ClickHouse provides several strategies.
Example strategy: Materialized Views for Pre-Aggregation —–
This example demonstrates how ClickHouse materialized views pre-aggregate high-cardinality Kafka data during insertion, enabling extremely fast analytics and queries. use this statement
CREATE MATERIALIZED VIEW user_daily_stats
ENGINE = SummingMergeTree()
PARTITION BY toYYYYMM(date)
ORDER BY (date, user_id)
AS SELECT
toDate(timestamp) AS date,
user_id,
count() AS event_count,
sum(value) AS total_value
FROM events
GROUP BY date, user_id;
11.Query Plan Optimization:
Understanding EXPLAIN
ClickHouse’s EXPLAIN command reveals how queries execute. Use it to identify bottlenecks.
EXPLAIN indexes = 1
SELECT user_id, count()
FROM events
WHERE event_time >= ‘2024-01-01’
AND event_type = ‘purchase’
GROUP BY user_id;
Key Metrics to Monitor:
• Rows Read: Should be orders of magnitude less than total rows
• Parts Skipped: High percentage indicates good primary key design
• Index Use: Bloom filters, minmax, set indexes should show ‘applied
12.Performance Tuning:
kafka_num_consumers: Match partition count for maximum throughput kaffka_max_block_size: Default 65536, increase to 1048576 for high-volume stream, kafka_poll_timeout_ms: Reduce to 100ms for lower latency
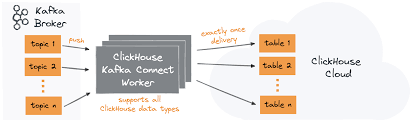
13.Multi-Format Ingestion: Kafka to ClickHouse
ClickHouse’s Kafka engine enables real-time ingestion with exactly-once semantics. The pattern involves a Kafka table, a materialized view, and a destination table.The following shows a sample example.
14 A sample flow shows integration from kafka to clickhouse table.
15.A sample example show To Ingest data from Kafka to ClickHouse
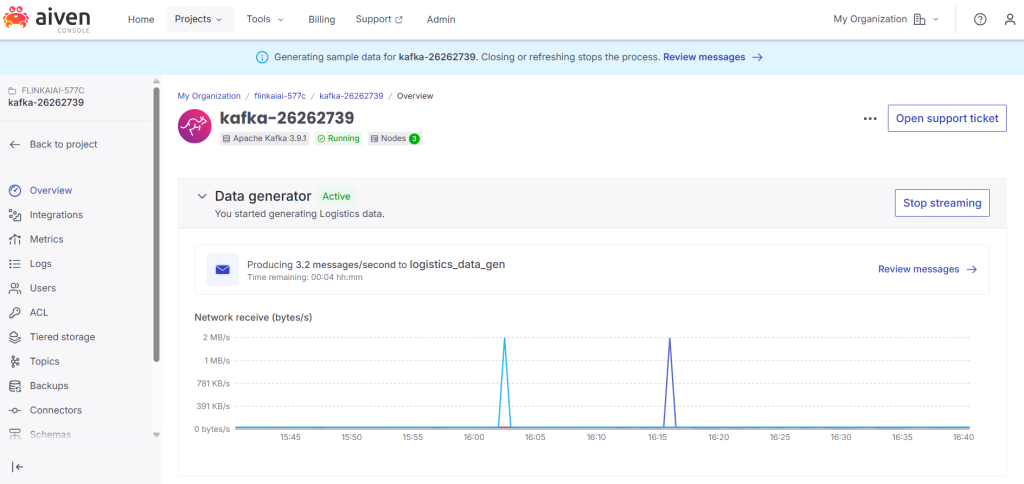
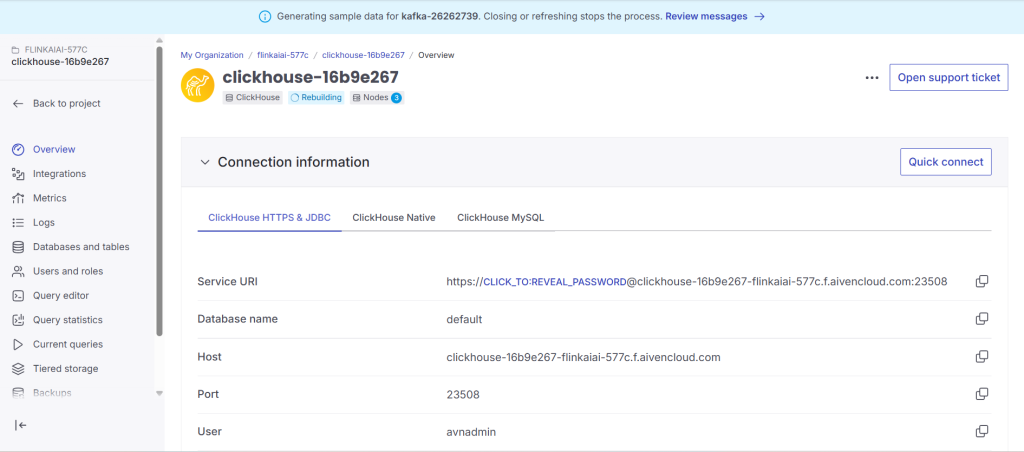
1.create Kafka and ClickHouse services.
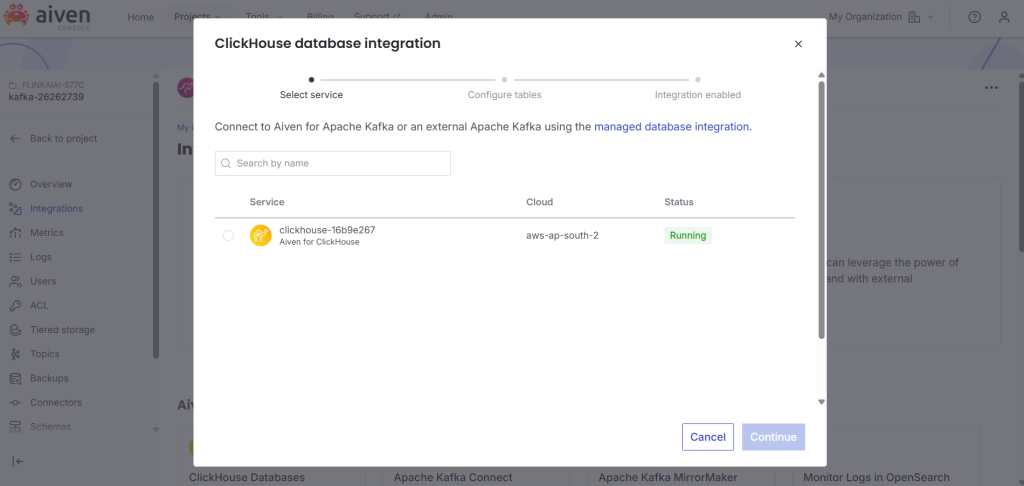
2..Integrate a clcikhouse with kafka
3.Run service in docker and create materliased views to view the streaming data from kafka to click[House.
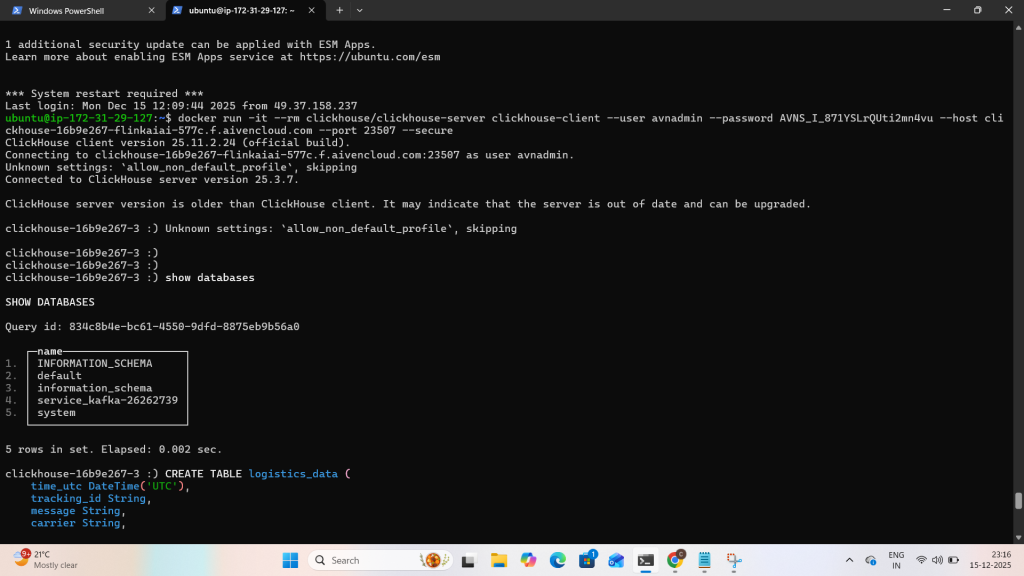
4.Run clickHouse service via docker and create materialised views and run the sample query as “SELECT * FROM <Table Name> Limit to view streaming data.
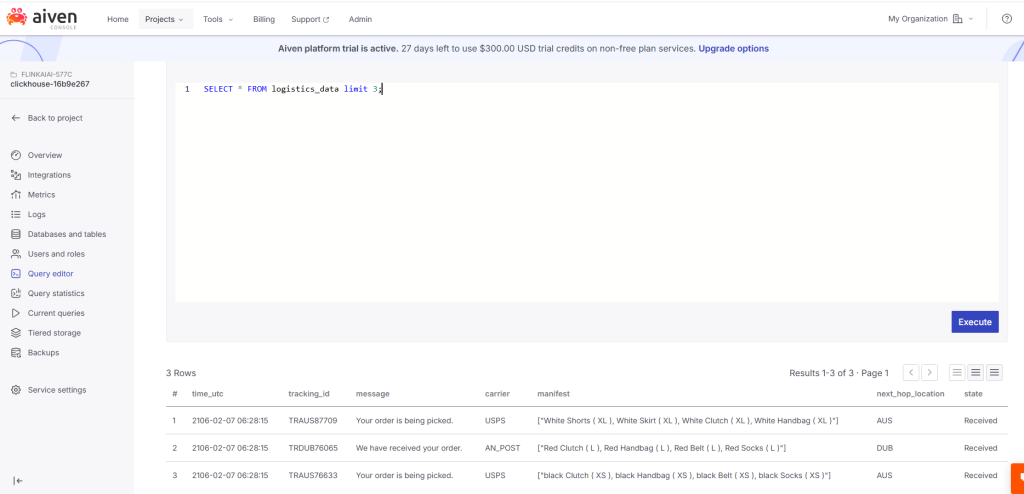
5. view the same Integration use aiven ClickHouse query editor and view the streaming messages from Kafka.