
We’re just into the 5th day of PG19 Hacktober, and we continue to see how PostgreSQL 19 beta 4 improves maintenance operational visibility for database administrators. PostgreSQL has always provided powerful maintenance capabilities. This time, PostgreSQL 19 takes another step forward by making these operations easier to observe and understand.
Here’s our today’s blog, focused on maintenance operational visibility in PostgreSQL 19 beta 4.
PostgreSQL 19 improves the observability of background maintenance jobs by adding more context to the progress views, introducing independent logging for automatic ANALYZE operations, and providing visibility into the amount of WAL space consumed by Full-Page Images (FPIs). With these enhancements, DBAs can get clearer answers to important questions like:
- How the VACUUM was triggered— A user explicitly ran VACUUM, or the autovacuum worker caused the operation.
- What type of VACUUM is running — normal, aggressive, or failsafe
- Who triggered the ANALYZE — manually or automatically by autovacuum
- How much WAL did the operation generate
- How much of that WAL was generated by Full-Page Images (FPIs)
These enhanced visibility features are particularly valuable for large databases, high-throughput workloads, and production environments where I/O activity and WAL generation require close monitoring. They enable DBAs to quickly identify unexpected maintenance activity, understand its impact on system resources, and take appropriate action when necessary.
Going Down Memory Lane
VACUUM and ANALYZE are not new features in PostgreSQL. They have been fundamental parts of PostgreSQL maintenance for many years.
What has evolved significantly is the amount of visibility PostgreSQL provides into these operations.
Earlier, a DBA could identify that a VACUUM or ANALYZE operation was running. However, for understanding who initiated it, how it was running, and what impact it had on WAL and I/O, they relied on additional sources.
PostgreSQL 19 improves this by exposing additional information directly through:
- Enhanced VACUUM and ANALYZE Progress view by adding additional columns
- Separate Logging for Automatic ANALYZE
- WAL Activity and Full-Page-Write Reporting
For VACUUM, the new started_by and mode columns provide additional context about why VACUUM started and how it is currently operating.
For ANALYZE, the new started_by column helps identify whether the operation was started manually or automatically by autovacuum.
PostgreSQL 19 also improves WAL visibility with the new wal_fpi_bytes statistic, which shows how much WAL space was consumed by Full-Page Images.
Together, these enhancements make routine maintenance activity much easier for DBAs to observe and troubleshoot.
What PostgreSQL 19 beta 4 Introduced
1. Enhanced pg_stat_progress_vacuum
PostgreSQL 19 introduces two new columns to pg_stat_progress_vacuum. These two columns are not available in PostgreSQL 18.
- started_by
- mode
started_by
The started_by column tells us how the VACUUM operation was started.
It can identify whether the operation was initiated as:
- manual — a user explicitly ran VACUUM
- autovacuum — VACUUM was started automatically as part of normal maintenance
- autovacuum_wraparound — VACUUM was started to prevent transaction ID or multixact ID wraparound
mode
The mode column tells us how the VACUUM operation is currently running.
It can indicate:
- normal — regular VACUUM processing
- aggressive — VACUUM is performing more extensive freezing and scanning pages that are not marked all-frozen
- failsafe — VACUUM has entered a mode where preventing transaction ID or multixact ID wraparound takes priority
For example, if we see:
started_by = autovacuum and mode = normalIt indicates that PostgreSQL automatically started a regular VACUUM as part of normal maintenance.
If we see:
started_by = autovacuum_wraparound and mode = aggressiveIt indicates that PostgreSQL started VACUUM because of wraparound protection and that the VACUUM is performing more extensive processing.
This additional context is particularly useful when a DBA notices high I/O or CPU usage and wants to understand why VACUUM is doing more work than expected.
Comparing New pg_stat_progress_vacuum Columns in PostgreSQL 18 vs. PostgreSQL 19 :
To verify the new columns, I compared the definitions of the pg_stat_progress_vacuum view in PostgreSQL 18 and PostgreSQL 19.
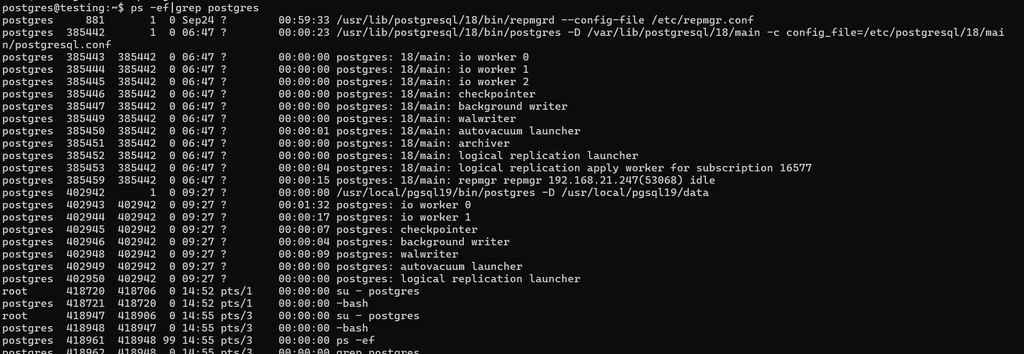
My lab environment: I have my PostgreSQL 18 and 19 Beta4 versions running on the same Ubuntu machine with different ports(5432 and 5433)
PostgreSQL 18:This represents the baseline progress information available in PostgreSQL 18.
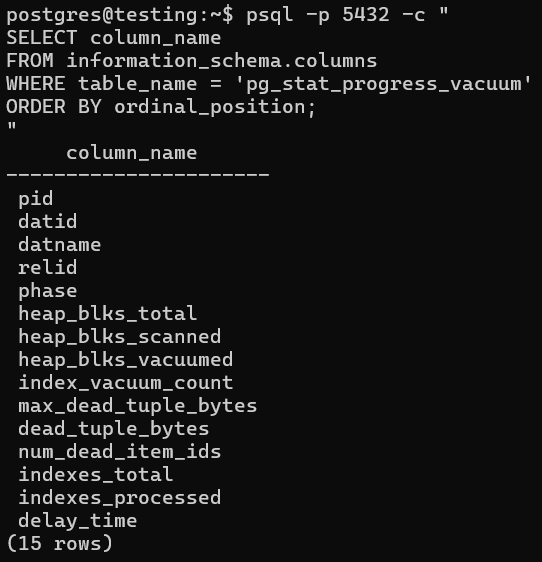
The output clearly confirms that PostgreSQL 18 shows only 15 columns.
PostgreSQL 19
In our PostgreSQL 19 environment, the same pg_stat_progress_vacuum view contains 17 columns.
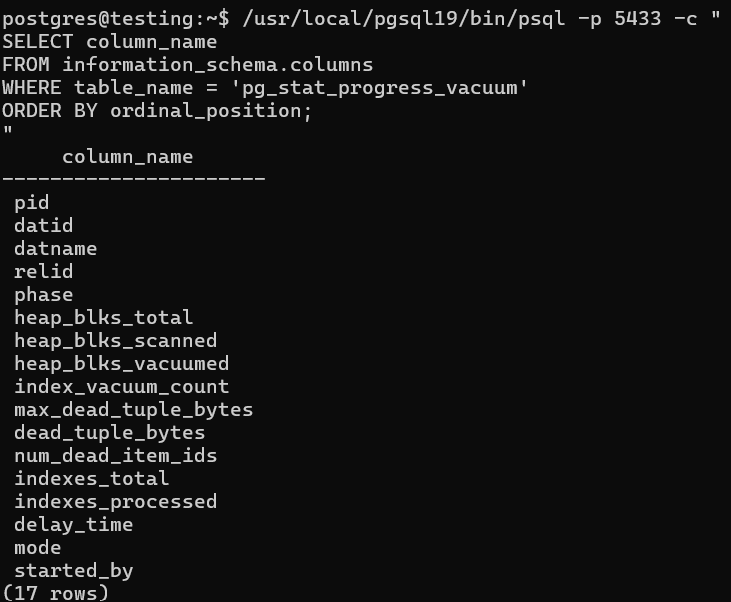
This confirms the addition of the two new monitoring columns:
- Mode
- started_by
Practical Demonstration: PostgreSQL 19 Beta 4 Enhancements
To test these enhancements, I used a PostgreSQL 19 Beta 4 environment.
Creating the Test Environment
1)I created a dedicated test database and a large table:
CREATE TABLE vacuum_test (
    id BIGSERIAL PRIMARY KEY,
    customer_name TEXT,
    description TEXT,
    amount NUMERIC(12,2),
    created_at TIMESTAMP DEFAULT now()
);

INSERT INTO vacuum_test
(customer_name, description, amount)
SELECT
    'Customer_' || g,
    repeat('PostgreSQL VACUUM progress monitoring ', 20),
    (random() * 100000)::numeric(12,2)
FROM generate_series(1, 5000000) AS g;

postgres=# SELECT pg_size_pretty(pg_total_relation_size('vacuum_test'));
 pg_size_pretty
----------------
 4449 MB
(1 row)
Generating Dead Tuples:
To simulate bloat and trigger maintenance activity, I have updated 3 million rows:
UPDATE vacuum_test
SET description = repeat('Updated PostgreSQL VACUUM monitoring ', 20)
WHERE id <= 3000000;
5) Verifying Table Statistics
SELECT
 N_live_tup,
N_dead_tup
FROM pg_stat_user_tables
WHERE relname = 'vacuum_test';
n_live_tup | n_dead_tup
------------+------------
 5000000    | 3000000
The table now contained approximately 3 million dead tuples, creating enough maintenance activity for us to observe VACUUM.
Test 1 – Identifying the Origin and Mode of VACUUM Using pg_stat_progress_vacuum
In earlier PostgreSQL versions, pg_stat_progress_vacuum showed what a vacuum worker was doing, but not who or what started it. PostgreSQL 19 introduces the started_by and mode columns directly into pg_stat_progress_vacuum, eliminating guesswork during production I/O spikes.
vacuum_lab=# SELECT
    pid,
    datname,
    relid::regclass AS table_name,
    phase,
    started_by,
    mode,
    heap_blks_total,
    heap_blks_scanned,
    heap_blks_vacuumed
FROM pg_stat_progress_vacuum;
During the test, we observed:
pid    | datname  | table_name |     phase      | started_by | mode   | heap_blks_total | heap_blks_scanned | heap_blks_vacuumed
--------+----------+------------+----------------+------------+--------+-----------------+-------------------+-------------------
 405139 | postgres | 16390      | scanning heap  | autovacuum | normal | 982994          | 109578            | 0
The important information here is:
- started_by = autovacuum
- mode = normal
- This immediately tells us that the VACUUM was automatically initiated by autovacuum and was currently operating in normal mode.
- Without this information, a DBA might see a VACUUM consuming I/O and need to perform additional investigation to understand where it came from.
- With PostgreSQL 19, that context is directly available in the progress view.
For DBAs managing busy production systems, this can make troubleshooting much faster, especially when multiple maintenance operations are running simultaneously.
Test 2 – Identifying the Execution Origin of ANALYZE Using pg_stat_progress_analyze
PostgreSQL 19 extends maintenance observability to statistics collection by introducing the started_by column to pg_stat_progress_analyze.
This column explicitly identifies the execution origin of an ANALYZE operation, allowing DBAs to instantly differentiate between:
- manual: An ANALYZE explicitly executed by a user or external script.
- autovacuum: An ANALYZE automatically triggered as part of background autovacuum maintenance.
2.1 Testing Manual ANALYZE Execution:
We first executed a manual ANALYZE on our test table in the session1
ANALYZE vacuum_test;The statistics sampling on medium-sized tables can complete in milliseconds. We monitored the progress view in a second session using \watch 0.2 to capture active states in real time:
In session 2:
SELECT
    pid,
    datname,
    relid::regclass AS table_name,
    phase,
    started_by
FROM pg_stat_progress_analyze;
While the operation was active, pg_stat_progress_analyze reported:
pid    | datname  | table_name  |         phase          | started_by
--------+----------+-------------+------------------------+-----------
 424974 | postgres | analyze_test | acquiring sample rows | manual

             Thu 01 Oct 2026 05:19:25 PM UTC (every 0.2s)

  pid   | datname  |  table_name  |        phase         | started_by
--------+----------+--------------+----------------------+------------
 424974 | postgres | analyze_test | computing statistics | manual
(1 row)

The value:
started_by = manual
Why this matters for DBAs: In busy production systems, DBAs don’t need to hunt through server logs to see why an ANALYZE is running. The started_by column instantly tells you whether it’s a routine background autovacuum or a manual DBA task.
Test 3 – Independent Logging for Automatic ANALYZE Using log_autoanalyze_min_duration
Before PostgreSQL 19, log_autovacuum_min_duration controlled logging for both VACUUM and automatic ANALYZE. Because ANALYZE runs much faster than VACUUM, setting a high threshold to capture slow vacuums often hid short, critical statistics updates.
PostgreSQL 19 decouples them into two independent parameters:
log_autovacuum_min_duration: Tracks autovacuumVACUUMruns.log_autoanalyze_min_duration: Tracks automaticANALYZEruns.
Configuration Options
Both parameters default to 10min and accept the following values:
- -1: Disables logging of vacuum operations
- 0: Logs all operations regardless of duration.
- >0: Logs operations exceeding the specified threshold (e.g., 250ms, 5s).
Instead, you can override the setting specifically for those critical tables:
ALTER TABLE events SET (log_autoanalyze_min_duration = 0);Why This Matters for DBAs
Decoupling these parameters allows DBAs to isolate statistics logging from vacuum activity. You can keep a high threshold for VACUUM to filter out log noise while using a low or zero threshold for ANALYZE to closely monitor query planner statistics updates on high-priority tables.
3.1 Testing Automatic ANALYZE Logging:
1. Enabling Auto-ANALYZE Logging:
We set log_autoanalyze_min_duration to 0 to capture every automatic ANALYZE operation.
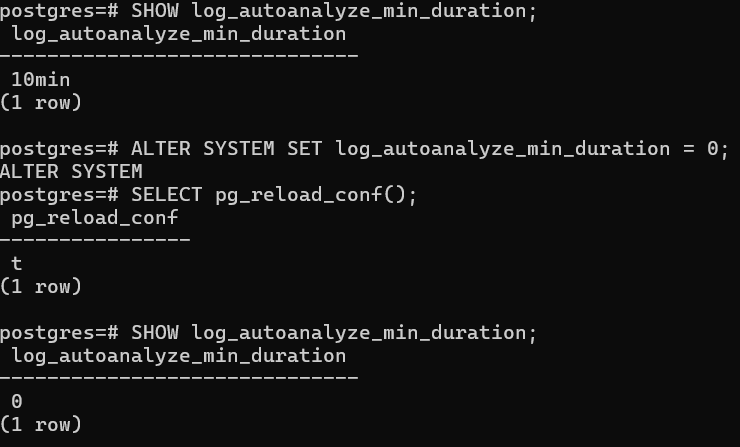
By default, log_autoanalyze_min_duration is set to 10min.
Observing Automatic ANALYZE in the PostgreSQL Server Logs
With logging enabled, we monitored the PostgreSQL log stream during background autovacuum execution. The resulting log entry gives a comprehensive breakdown of resource utilization:

Log Output Summary:
At 17:57:21, autovacuum executed an automatic ANALYZE on analyze_test. In 1.17 seconds, it scanned 27,812 disk blocks (~217 MB) and generated 35.8 KB of WAL (including 6 Full-Page Images).
How This Helps DBAs
Instead of guessing the impact of background maintenance, DBAs get exact metrics on disk reads, CPU utilization, and WAL volume generated by statistics updates during an ANALYZE operation.
3.2 Verifying ANALYZE Activity using pg_stat_all_tables catalog view:
This query against pg_stat_all_tables provides table-level maintenance statistics, showing exactly when and how often ANALYZE was performed on public.analyze_test:

How it helps DBAs:
If analyze_count is high while autoanalyze_count remains low, it warns DBAs that autovacuum thresholds are set too conservatively for that table, forcing manual intervention to keep query plans accurate.
Test 4 – Measuring Full-Page Image WAL Usage with wal_fpi_bytes:
PostgreSQL 19 significantly enhances visibility into Write-Ahead Logging (WAL) by providing precise byte-level tracking for Full-Page Images (FPIs).
Understanding FPI Generation :
PostgreSQL stores data in 8 KB pages in memory and periodically flushes them to disk during checkpoints. When a page is modified for the first time following a checkpoint, PostgreSQL writes a complete copy of that page known as a Full-Page Image (FPI) to the Write-Ahead Log (WAL). This complete page copy serves as a critical safety mechanism against torn pages caused by power failures or system crashes during a disk write, allowing recovery processes to restore the page to a consistent state. Because background maintenance routines like VACUUM and ANALYZE scan and update metadata across large swaths of table pages, they frequently trigger heavy FPI generation even when no user-driven INSERT, UPDATE, or DELETE queries are actively running.
Inspecting Global WAL Statistics:
Prior to PostgreSQL 19, monitoring interfaces only reported wal_fpi, which tracked the raw count of full-page images.PostgreSQL 19 introduces wal_fpi_bytes, exposing the exact payload size in bytes consumed specifically by FPIs across system views like pg_stat_wal.
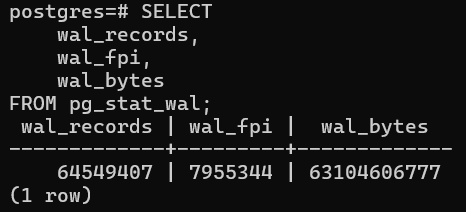
How it helps DBAs:
This new wal_fpi_bytes helps DBAs understand how much WAL space is being consumed by Full-Page Images, especially during operations like VACUUM.
Here is the youtube video:
Conclusion
PostgreSQL 19 beta 4 doesn’t change how VACUUM and ANALYZE work, but makes them much easier to observe and troubleshoot. It covers four improvements:
pg_stat_progress_vacuumgets two new columns (15 → 17 columns total)started_byshows whether the VACUUM wasmanual,autovacuum, orautovacuum_wraparound.modeshows whether it’s running asnormal,aggressive, orfailsafe.- In the author’s test, a live view showed
autovacuum+normal, answering “who started this and why is it busy?” without extra digging.
pg_stat_progress_analyzegetsstarted_by- Distinguishes
manualANALYZE fromautovacuum-triggered ANALYZE, so DBAs don’t need to search server logs.
- Distinguishes
- Independent logging for auto-ANALYZE (
log_autoanalyze_min_duration)- Previously,
log_autovacuum_min_durationcontrolled logging for both VACUUM and auto-ANALYZE. - Now they’re separate (both default to 10min). You can keep a high threshold for VACUUM to reduce noise while logging every auto-ANALYZE (
0), globally or per table. - The example log showed duration, blocks scanned, and WAL generated (35.8 KB, including 6 FPIs).
- Previously,
- New
wal_fpi_bytesstatistic- Before, only the count of full-page images (
wal_fpi) was reported. Now the actual WAL bytes consumed by FPIs are visible, e.g. inpg_stat_wal, which helps explain WAL volume during VACUUM/ANALYZE.
- Before, only the count of full-page images (
These changes give DBAs faster answers about who started a maintenance job, how it’s running, and what it costs in WAL and I/O. They’re most useful for large, high-throughput production systems where unexpected maintenance activity needs quick diagnosis.
Thank you!!